
Modern machine learning projects often involve large amounts of unstructured and unlabeled data. What is hierarchical clustering, and how does it help organize this information into meaningful groups? By building a hierarchy of related clusters, this technique helps analysts identify patterns and relationships within complex datasets. At FPT AI Factory, organizations can leverage scalable AI infrastructure and advanced AI platforms to develop and deploy machine learning solutions more efficiently.
Key Takeaways:
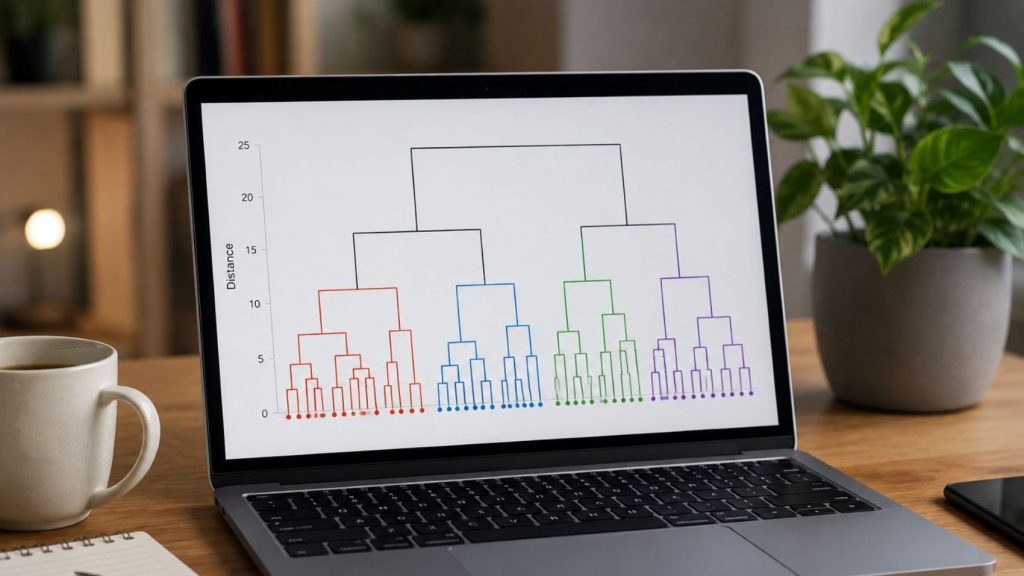
- Hierarchical clustering is an unsupervised technique that groups data points into nested clusters, visualized as a tree-like dendrogram
- Two main approaches: agglomerative (bottom-up, merging clusters) and divisive (top-down, splitting clusters)
- Unlike K-Means, it doesn’t require choosing the number of clusters in advance — you decide by cutting the dendrogram at the right level
- Best for exploratory analysis, customer segmentation, and interpretability; less efficient than K-Means for very large datasets
1. What Is Hierarchical Clustering?
Hierarchical clustering is a popular unsupervised machine learning technique that groups similar data points into a layered hierarchy. Unlike supervised methods, it operates without any labeled training data. Instead, the algorithm measures the closeness or distances between data points, gradually combining them into nested groups. This process creates a tree-like visual structure known as a dendrogram.
For example, streaming services like Netflix utilize hierarchical clustering to segment users based on their viewing habits and preferences. Viewers who enjoy the same genres, such as crime thrillers or documentaries, are clustered into smaller sub-groups before being merged into broader audience categories. This allows businesses to better grasp customer tastes and deliver highly accurate content recommendations.
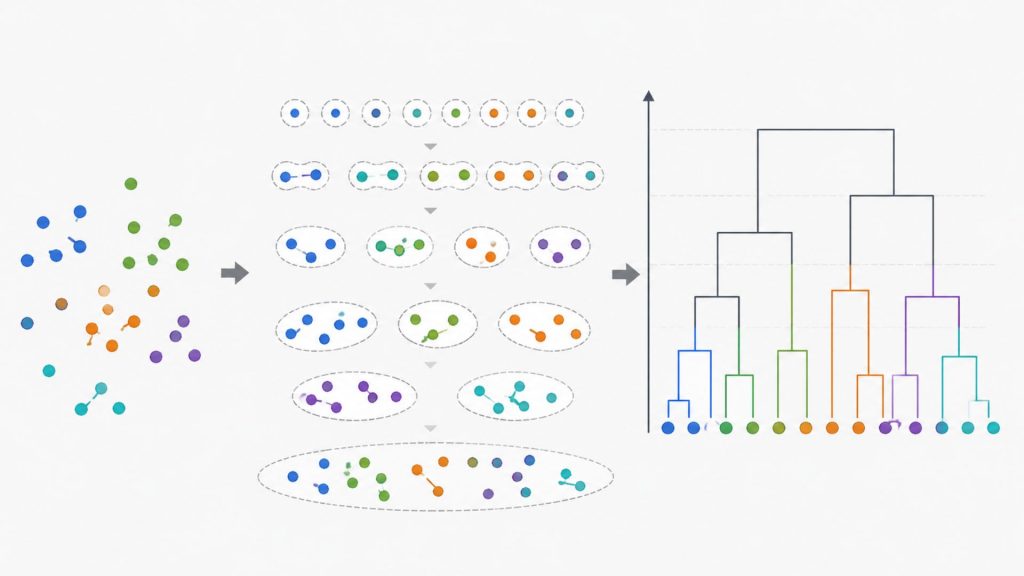
Hierarchical clustering groups similar data points into nested clusters based on their distance and relationships.
>>> Explore: What is a GPU cluster? Architecture, Nodes and Use Cases
2. How Does Hierarchical Clustering Work?
Hierarchical clustering organizes data points into a tree-like structure based on their similarity. The process typically follows a bottom-up or top-down approach, gradually forming clusters and representing their relationships visually through a dendrogram.
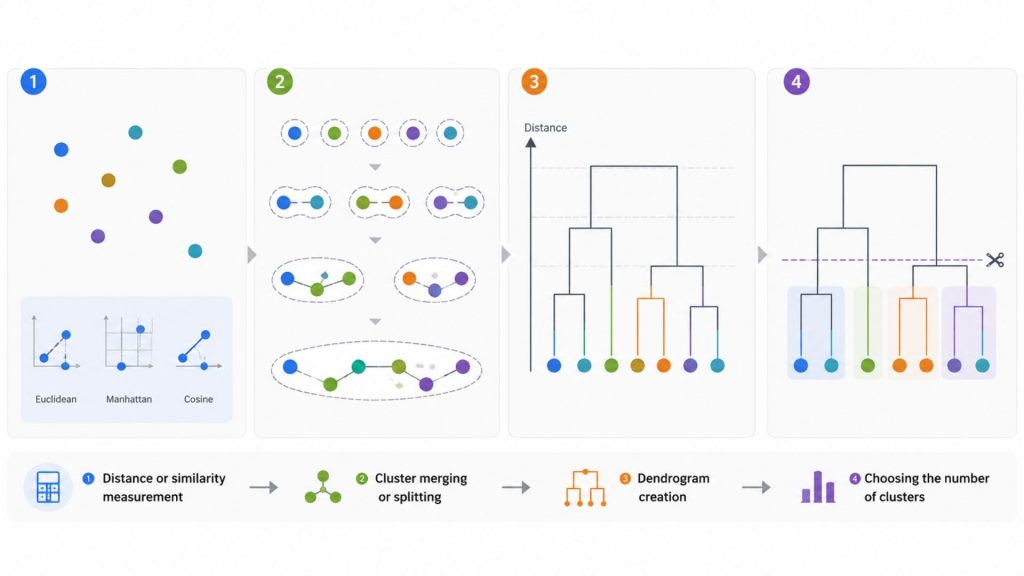
2.1 Distance or similarity measurement
The first step is calculating the similarity or distance between data points. Common distance metrics include Euclidean distance, Manhattan distance, and cosine similarity, depending on the type of dataset. These metrics define how close or far data points are from each other and form the foundation of clustering decisions.
2.2 Cluster merging or splitting
After distances are computed, the algorithm begins forming clusters. In agglomerative clustering, each data point starts as an individual cluster, and the closest clusters are merged step by step. In divisive clustering, the process starts with one large cluster and progressively splits it into smaller clusters. Linkage methods determine how distances between clusters are calculated during this process.
2.3 Dendrogram creation
As clustering progresses, a dendrogram is constructed to visualize the hierarchical relationships. This tree-like structure shows how clusters are merged or split at different distance levels, helping analysts understand data relationships and structure.
2.4 Choosing the number of clusters
The final step is selecting the number of clusters by cutting the dendrogram at a specific level. Different cut points produce different cluster groupings, ranging from broad segments to more detailed subgroups. The optimal choice depends on the dataset and the analytical objective.
2.5 A Simple Example
Imagine five customers with these average order values: A ($20), B ($25), C ($80), D ($85), and E ($82).
- Step 1: Each customer starts as its own cluster.
- Step 2: The algorithm merges the closest pair first — D and E ($85 and $82) are merged since they’re most similar.
- Step 3: Next, A and B ($20 and $25) are merged.
- Step 4: C joins the D-E cluster, since $80 is closer to that group than to A-B.
- Step 5: Finally, the two remaining clusters merge into one, completing the dendrogram.
The result reveals two natural customer segments — low spenders (A, B) and high spenders (C, D, E) — without ever specifying “2 clusters” in advance.
Hierarchical clustering forms nested groups by measuring similarities between data points and visualizing them through a dendrogram
3. Types of Hierarchical Clustering
Hierarchical clustering is mainly divided into two types based on how the clustering process is built: a bottom-up approach and a top-down approach. Each type follows a different strategy but ultimately produces a hierarchical structure of data.
3.1 Agglomerative clustering
Agglomerative clustering is a bottom-up method where each data point starts as its own individual cluster. The algorithm then repeatedly merges the most similar clusters until a single hierarchical structure is formed or a stopping condition is reached. This approach is widely used because it is intuitive and easy to interpret through a dendrogram, which shows how clusters are gradually combined.
Example: A streaming platform like Spotify can analyze listening behavior (e.g., genre preference, listening time, and skipped tracks) to group users with similar patterns. For instance, users who frequently listen to indie and acoustic playlists may first form small clusters, which are then merged into broader segments such as “relaxation listeners” or “focus music users.”

Users with similar music preferences are gradually merged into larger listener groups based on shared listening behavior
3.2 Divisive clustering
Divisive clustering is a top-down method, which works in the opposite way. It begins with all data points grouped into one large cluster and then progressively splits them into smaller and more specific clusters based on differences in the data. Although less commonly used, it is helpful when analysts want to break down a dataset from a broad overview into more detailed segments.
Example: A retail company like Amazon can start with all customers in one dataset and progressively split them based on purchasing behavior, such as separating high-frequency buyers from seasonal shoppers, and then further dividing them into categories like electronics buyers, fashion shoppers, or home product customers.
4. Linkage methods in hierarchical clustering
Linkage methods define how the distance between two clusters is calculated. Since clusters contain multiple data points, different strategies are used to determine inter-cluster similarity. These methods significantly influence the final clustering structure.
Common linkage strategies include:
- Single linkage (minimum distance)
- Complete linkage (maximum distance)
- Average linkage (average distance)
- Ward’s method (minimizing variance)
Examples:
- In e-commerce analytics, a platform like Alibaba Group may apply different linkage strategies to group buyers based on purchasing patterns, helping improve product recommendation accuracy across large-scale user data.
- In social media platforms, a company like Meta can cluster users with similar engagement behaviors to optimize content ranking and ad targeting strategies.
- In financial services, banks may use linkage-based clustering to group customers with similar transaction behaviors, supporting fraud detection and customer segmentation models.
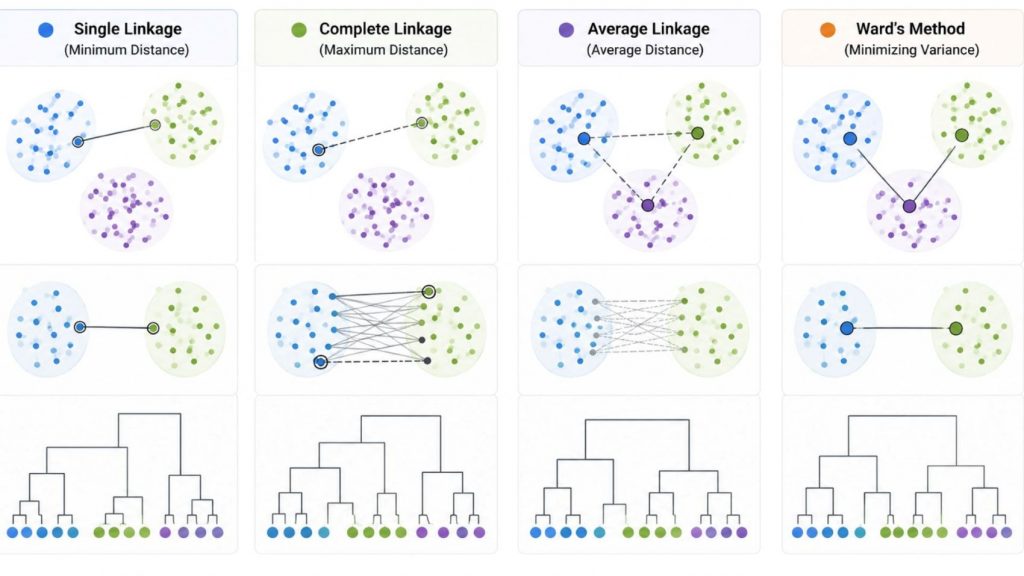
Different linkage methods calculate cluster similarity in different ways, resulting in distinct hierarchical clustering structures.
5. Distance metrics for clustering
Distance metrics are mathematical methods used to measure how similar or different two data points are in hierarchical clustering. These measures help the algorithm determine which observations are closest to each other, forming the basis for how clusters are built and structured. Depending on the type of data, different metrics can be used to better capture relationships between data points and improve clustering accuracy.
Examples in practice:
- In document analysis, cosine similarity is often used to compare the similarity between two pieces of text based on their meaning and word distribution.
- In logistics and delivery optimization, Manhattan distance is commonly applied to estimate movement cost in grid-like city layouts, such as routing between warehouses and delivery points.
- In healthcare analytics, Euclidean distance can help compare patient records based on numerical indicators like age, blood pressure, or test results.
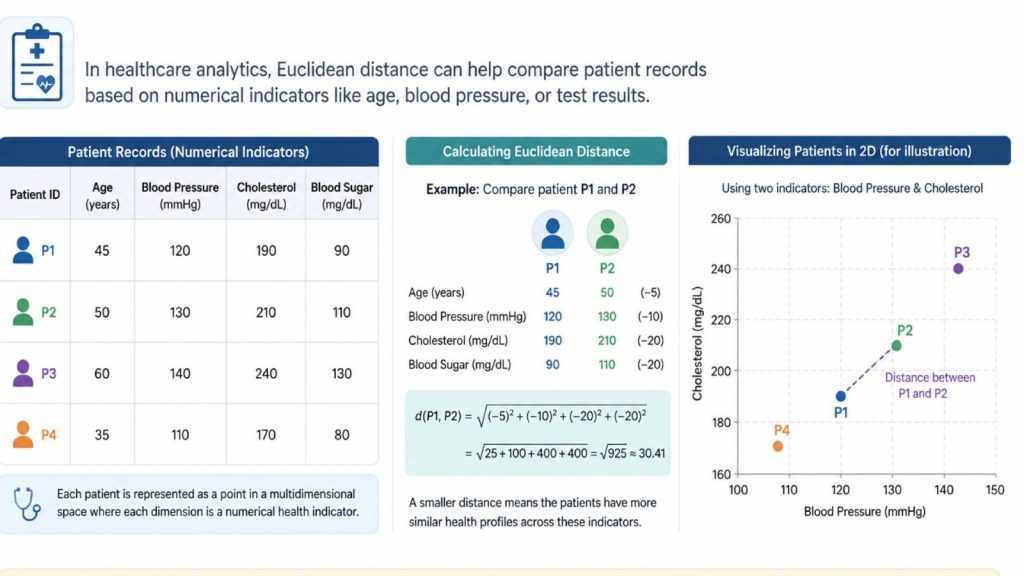
Euclidean distance helps measure how similar or different patients are based on numerical health data
>>> Explore: What Is Data Infrastructure? Key Components and How to Build It
6. Hierarchical Clustering vs K-Means Clustering
Hierarchical clustering and K-Means clustering are both unsupervised methods for grouping data, but they differ in how clusters are formed. K-Means requires a fixed number of clusters, while hierarchical clustering builds a hierarchy that can be cut at different levels. The table below shows a clear comparison between the two methods.
| Criteria | Hierarchical Clustering | K-Means Clustering |
| Clustering approach | Builds clusters using a hierarchical process (bottom-up or top-down) | Partitions data into K clusters by iteratively optimizing cluster centroids |
| Number of clusters | Not required in advance; can be chosen after analyzing the dendrogram | Must be defined before training |
| Output structure | Tree-like structure (dendrogram) showing nested relationships | Flat, non-overlapping clusters |
| Interpretability | High, allows visualization of cluster relationships | Moderate, no hierarchical relationships |
| Scalability | Less efficient for large datasets | Efficient and scalable for large datasets |
| Sensitivity to outliers | Often more sensitive to noise and outliers | Generally less sensitive to outliers |
| Best use case | Exploratory data analysis and understanding data structure | Large-scale clustering in production systems |
| Example | Customer segmentation where relationships between groups need to be explored | User segmentation in recommendation systems at scale |
7. Benefits of Hierarchical Clustering
Hierarchical clustering is an unsupervised machine learning technique that forms a nested, tree-like structure of clusters (a dendrogram). It is especially useful because it does not require defining the number of clusters in advance and can effectively represent complex, multi-level relationships within data.
Key benefits include:
- No predefined number of clusters required: Unlike methods such as K-Means, you do not need to decide the number of clusters before running the algorithm.
- Easy-to-understand visualization: The output dendrogram clearly shows how data points and clusters are progressively merged, making relationships easier to interpret.
- Flexible cluster selection: The final number of clusters can be chosen after analysis by cutting the dendrogram at the most meaningful level for the problem.
- Ability to capture complex structures: It can handle clusters with different shapes and sizes, rather than being limited to simple geometric forms.
- Multi-level insights: The hierarchical structure reveals both small sub-groups and larger overarching clusters, helping uncover deeper patterns in the data.
Hierarchical clustering visualizing multi-level data relationships without predefined cluster boundaries
8. Hierarchical Clustering Use Cases
Hierarchical clustering is applied in many real-world scenarios where discovering hidden relationships and grouping similar data points is important. It helps organizations structure complex datasets into meaningful clusters for analysis, prediction, and decision-making.
8.1 Customer segmentation
Hierarchical clustering is widely used to group customers based on shared characteristics such as purchasing behavior, spending patterns, browsing history, or demographic attributes. Unlike simple segmentation methods, it can reveal multiple layers of customer groups, from broad segments down to very specific sub-groups.
Example: Starbucks uses hierarchical clustering on its loyalty program data to segment customers not just by “coffee drinkers,” but into sub-clusters based on purchase frequency, preferred times of day, and sensitivity to discounts. This allows them to send hyper-personalized offers via their mobile app.
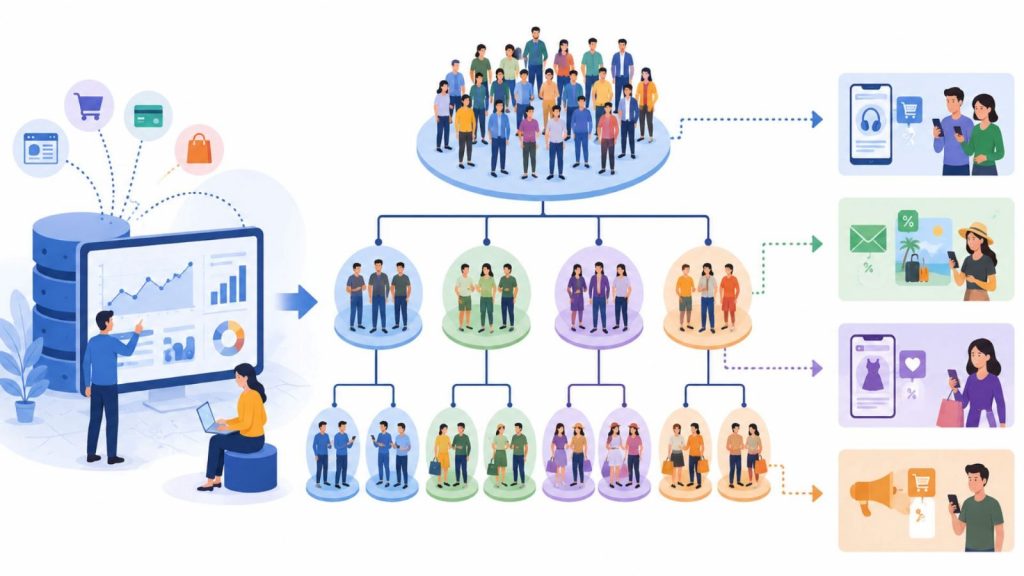
Hierarchical clustering for personalized customer targeting
8.2 Document and text clustering
In natural language processing, hierarchical clustering is used to organize large volumes of unstructured text into meaningful topic structures. It helps group documents based on semantic similarity rather than manual labeling, making it useful for large-scale information management.
Example: Reuters and Bloomberg utilize hierarchical text clustering to automatically categorize thousands of daily financial news articles into a structured taxonomy (e.g., Economy -> Fintech -> Cryptocurrency), ensuring real-time feed accuracy for traders.
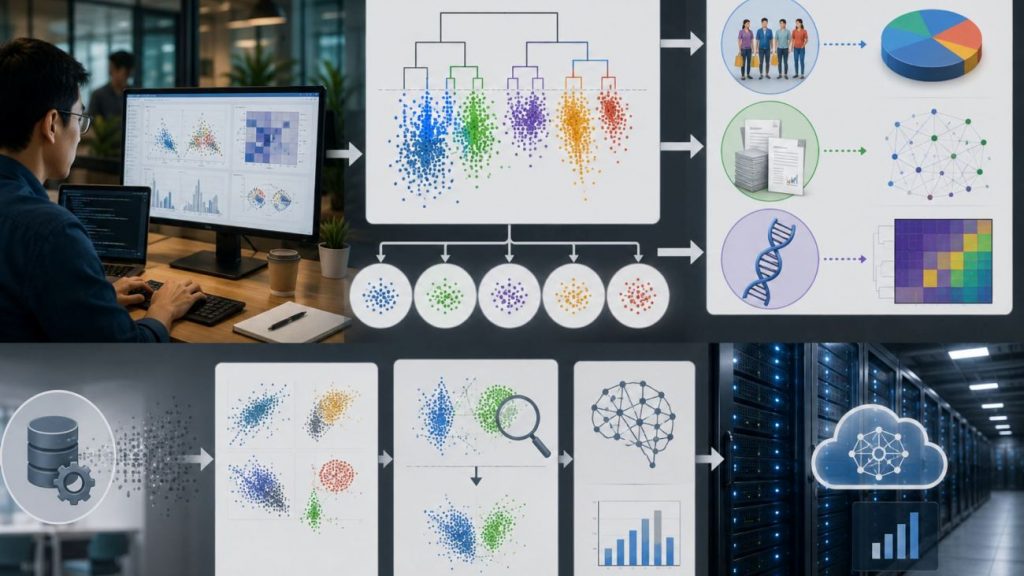
8.3 Biology and genomics analysis
In bioinformatics, hierarchical clustering is applied to analyze complex biological data such as gene expression profiles, DNA sequences, and protein structures. It helps researchers identify relationships between biological samples and discover meaningful patterns in high-dimensional datasets.
Example: The Cancer Genome Atlas (TCGA) project widely uses hierarchical clustering (agglomerative) to group patients based on gene expression profiles. This helped discover distinct molecular subtypes of breast cancer, leading to targeted therapies.
8.4 Image grouping and pattern recognition
Hierarchical clustering is also used in computer vision to group images based on shared visual features such as color distribution, texture, or structural patterns. This helps in organizing large image datasets and identifying visual similarities.
Example: In healthcare, systems like GE Healthcare’s Edison platform use clustering to group similar patterns in X-rays and MRI scans, helping radiologists flag anomalies faster by comparing them to historical clusters.

Clustering medical scans to detect similar abnormal patterns efficiently
8.5 Market research and behavior analysis
In social network analysis, hierarchical clustering helps identify communities of users based on interaction patterns, shared interests, or communication frequency. It can reveal both large communities and smaller sub-groups within networks.
Example: Netflix leverages clustering algorithms to build its “taste communities.” Instead of just grouping users by country or age, it creates a hierarchy of user behaviors to recommend niche regional content to global audiences.
8.6 Machine learning experimentation and analysis
Hierarchical clustering is commonly used in exploratory data analysis and model experimentation. Data scientists use it to understand dataset structure, compare clustering approaches, and evaluate how different configurations affect results through dendrogram visualization.
For this purpose, tools like AI Notebook from FPT AI Factory provide an interactive environment where users can explore datasets, visualize hierarchical relationships, and test different clustering strategies during machine learning workflows.
Example: A data scientist can use AI Notebook to compare linkage methods (single, complete, average, Ward’s method) and analyze how each approach changes the clustering structure of the same dataset.

AI Notebook supports dataset exploration and clustering experimentation in ML workflows.
>>> Explore: What Is JupyterHub? How It Works and Practical Applications
9. Hierarchical Clustering in Modern Machine Learning Workflows
In modern ML/AI pipelines, hierarchical clustering is mainly used as an exploratory technique in the data exploration (EDA) stage. It helps analysts understand the structure of unlabeled data and identify patterns at different levelsThese insights are then used to guide downstream decisions across AI data pipeline workflows such as segmentation design, feature selection, or choosing more scalable clustering methods for production, especially in AI Data Center environments.
During EDA, hierarchical clustering generates a dendrogram that shows how data points are gradually merged into clusters. This helps estimate the appropriate number of clusters, check whether natural group structures exist, and support multi-level analysis such as customer segmentation, document grouping, or biological data classification.
A key advantage of this method in modern workflows is its high interpretability. It can represent both small subgroups and larger cluster hierarchies in a single structure. Because of this, it is especially useful in explainable AI (XAI), where stakeholders need to understand not only the results but also how the clusters are formed.
However, hierarchical clustering has limitations in production environments. It can require significant computational resources, particularly when working with large datasets because of the many distance comparisons involved. It is also sensitive to preprocessing, distance metrics, and linkage methods, which can significantly change the results. Therefore, it is often used together with sampling techniques or combined with scalable algorithms like K-Means in real-world systems.
Exploring data structures with hierarchical clustering
>>> Explore: What Is AI Infrastructure? Key Components and How It Works
10. Challenges of Hierarchical Clustering
Hierarchical clustering is a powerful unsupervised learning method that builds nested clusters without requiring a predefined number of groups. However, it follows a greedy, single-pass process and comes with several important limitations that affect its scalability and stability in real-world applications.
- High computational cost for large datasets: The algorithm requires pairwise distance calculations, making it expensive in both time and memory when applied to large-scale data, especially in environments that rely on GPU computing for high-performance processing.
- Sensitive to distance metrics and linkage methods: Different choices of distance measures and linkage strategies can lead to significantly different clustering results.
- Affected by noise and outliers: Outliers can distort the hierarchical structure and influence how clusters are formed.
- Subjective dendrogram interpretation: Choosing where to cut the dendrogram is not always clear and often depends on user judgment.
- Less flexible after merging or splitting: Once clusters are formed, the process cannot be easily reversed or adjusted, limiting flexibility.
- Requires proper preprocessing and feature scaling since inconsistent feature ranges can distort distance calculations.
11. FAQs
11.1. What is the difference between hierarchical clustering and k-means?
The main difference is that K-Means groups data into a fixed number of non-overlapping clusters defined in advance, while hierarchical clustering builds a tree-like structure of nested clusters that can be cut at different levels. K-Means is generally faster and more suitable for large datasets, whereas hierarchical clustering provides better interpretability and does not require the number of clusters to be set beforehand.
11.2. When should hierarchical clustering be used?
Hierarchical clustering is best used when you need to explore data structure without knowing the exact number of clusters in advance, or when interpretability through a dendrogram is important. It is suitable for datasets with natural hierarchical relationships and works well for discovering both broad and detailed groupings. However, due to its high computational cost, it is mainly recommended for small to medium-sized datasets.
11.3. Is hierarchical clustering supervised or unsupervised?
Hierarchical clustering is an unsupervised machine learning method that works with unlabeled data. It groups data points based on their similarity or distance and organizes them into a nested tree-like structure (dendrogram) without using predefined labels or target categories.
Understanding what hierarchical clustering is becomes essential when exploring how machine learning models organize unlabeled data into meaningful groups. As an unsupervised learning technique, hierarchical clustering creates a tree-like structure that helps uncover hidden patterns and relationships within datasets.
11.4. How do you choose the number of clusters in hierarchical clustering?
You choose the number of clusters by cutting the dendrogram at a specific height. A common approach is to look for the longest vertical line that isn’t crossed by any horizontal merge line, then cut through it — the number of vertical lines it crosses becomes the number of clusters.
If you want to start experimenting with AI and clustering workflows, you can sign up and receive $100 free credits, which can be used immediately after login to explore and test your models. For enterprises, organizations, or teams that need customized solutions or large-scale AI infrastructure, you can contact the FPT AI Factory team through the official contact form for dedicated consultation and support.
Contact Information:
- Hotline: 1900 638 399
- Email: support@fptcloud.com
Read more:
What is Data Annotation? Types, Challenges, Use Cases
What is Pipeline in Machine Learning? Why It’s Important
What is a Data Catalog? Types, Benefits, Core Features
ETL vs ELT: Which Data Pipeline Should You Choose?
This article is compiled and referenced from reputable sources in machine learning and data science, and reviewed by FPT AI Factory’s technical specialists before publishing to ensure accuracy and reliability.
Sources referenced: GeeksforGeeks, Displayr, Statistics How To
Last updated: Jul 20th 2026