
Evaluation metrics in machine learning are the foundational tools used to quantify the accuracy, reliability, and overall performance of predictive models. By understanding and applying the right metrics, businesses can easily identify model weaknesses and ensure their AI solutions deliver tangible value in real-world scenarios. At FPT AI Factory, we empower enterprises with cutting-edge infrastructure to build, rigorously evaluate, and scale high-performing AI models.
|
Quick summary
|
1. What are evaluation metrics in machine learning?
Evaluation metrics in machine learning are quantitative measurements used to assess the performance, accuracy, and reliability of an AI model. Instead of relying on guesswork, these metrics provide a standardized way to score how well your model interprets data and predicts outcomes. Think of them as vital health checks for your AI system, ensuring it operates effectively before being deployed into the real world.

Evaluation metrics in machine learning are quantitative measurements used to assess the performance
2. Why evaluation metrics matter?
Building a machine learning model is only the first step, evaluating its true capabilities is what ultimately determines its success in a business environment. Here is exactly why prioritizing these strategic measurements is essential for your successful enterprise AI deployment:
- Measure model accuracy and effectiveness: Metrics provide concrete, quantifiable data to verify that your AI model is generating correct predictions and functioning exactly as intended.
- Help compare different models: When testing multiple algorithms, evaluation metrics offer an objective baseline to confidently choose the best-performing solution for your specific use case.
- Detect overfitting and underfitting: These measurements quickly identify if a model is just memorizing training data or failing to learn, ensuring it can generalize well to new, unseen information.
- Align model performance with business goals: By choosing the right metrics, you can directly connect technical AI outcomes to tangible business objectives like revenue growth, risk reduction, or customer satisfaction.
- Support continuous improvement in production: Actively monitoring these metrics post-deployment allows your team to catch performance drops early, enabling proactive updates and maintaining the model’s reliability over time.

Evaluating its true capabilities is what ultimately determines its success
3. Types of evaluation metrics in machine learning
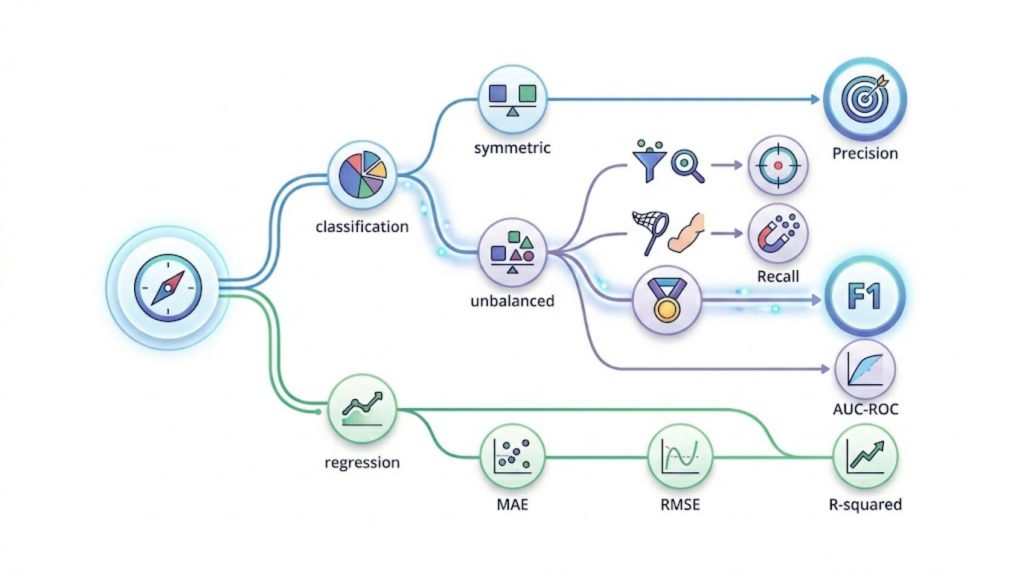
To effectively evaluate AI performance, data scientists must categorize metrics based on the specific type of machine learning problem being solved. Let’s explore the primary categories of evaluation metrics and how they apply to different enterprise use cases.
3.1. Classification metrics
Classification metrics are designed to evaluate models that sort data into distinct categories, such as identifying spam emails or diagnosing diseases. They help you clearly understand how often your AI makes the correct categorical prediction in real-world scenarios.
- Accuracy: Measures the overall percentage of correct predictions out of all total cases evaluated. If an AI correctly identifies 90 out of 100 customer support tickets as either “urgent” or “normal,” its accuracy is 90%.
- Precision: Focuses on the quality of positive predictions, measuring how many of the predicted positive cases were actually correct. Out of 50 transactions flagged as “fraudulent,” if 45 were truly fraudulent, the precision is highly reliable.
- Recall: Evaluates the model’s ability to successfully find all actual positive cases hidden within the dataset. For example, if there are 100 real defective products on a factory line and the AI detects 80 of them, the recall is 80%.
- F1-score: Combines precision and recall into a single balanced score, which is highly valuable when dealing with uneven data distributions. Use the F1-score when detecting a rare financial anomaly, where missing a case or falsely flagging one is both costly.
- ROC-AUC: Illustrates how well a model distinguishes between two different classes across various mathematical threshold settings. A high ROC-AUC score means your AI is exceptionally good at separating loyal customers from those likely to churn.
- Confusion matrix: A visual table that breaks down the exact numbers of true positives, true negatives, false positives, and false negatives. It allows business teams to quickly see exactly where the model is getting confused between similar product categories.
Use classification metrics whenever your model outputs discrete labels or categories. Accuracy works well for balanced datasets. Precision, recall, and F1-score are more appropriate when classes are imbalanced or when the cost of false positives and false negatives differs significantly. ROC-AUC is ideal for comparing models or evaluating performance across thresholds.

Classification metrics are designed to evaluate models that sort data into distinct categories
3.2. Regression metrics
Regression metrics are utilized when your machine learning model predicts continuous numerical values instead of distinct categories. These measurements calculate the exact distance between the AI’s predicted numbers and the actual real-world figures.
- Mean Absolute Error (MAE): Calculates the average absolute difference between predicted and actual values without heavily penalizing large errors. If a retail AI predicts daily sales, MAE tells you it is off by an average of $500 per day.
- Mean Squared Error (MSE): Similar to MAE, but it squares the differences, which heavily penalizes the model for making very large prediction errors. Useful in stock market predictions, where a massive miscalculation is far more damaging than a minor one.
- Root Mean Squared Error (RMSE): The square root of MSE, bringing the error metric back to the original unit of measurement for easier interpretation. If predicting real estate prices, RMSE tells you the average error in actual dollars, making it intuitive for stakeholders.
- R-squared (R²): Represents the proportion of variance in the target variable that is smoothly explained by your AI model. An R² score of 0.85 means your model can confidently explain 85% of the factors influencing your company’s monthly revenue.
Use regression metrics when your model outputs continuous numerical values, such as predicting prices, temperatures, or demand forecasts. MAE is preferred when you want a straightforward, outlier-resistant measure. MSE and RMSE are better when large errors are particularly costly, and you want the model to be penalized for them. R² is most useful for understanding overall model fit and comparing models on the same dataset.
3.3. NLP and generative AI evaluation metrics
Evaluating language models is more complex than evaluating classifiers. There is rarely a single “correct” output, a good translation, a useful summary, or a compelling piece of generated text can take many forms. NLP and generative AI metrics try to capture quality across dimensions like fluency, relevance, and factual accuracy.
- BLEU: Measures the similarity between machine-translated text and high-quality human reference translations using word overlap. Commonly used to quickly evaluate if an automated translation tool accurately converted a corporate contract from English to Vietnamese.
- ROUGE: Evaluates text summarization models by checking how many key phrases from a human-written summary appear in the AI’s version. Perfect for assessing an AI agent that automatically summarizes lengthy financial reports for executive teams.
- Perplexity: Measures how confident an AI language model is in correctly predicting the next word in a sequence. A lower perplexity score indicates that your customer service chatbot communicates smoothly and predictably, much like a real human.
- BERTScore: Uses advanced pre-trained language models to evaluate the underlying meaning and semantic similarity of AI-generated text. It correctly rewards an AI that says “happy” instead of “glad,” recognizing the identical meaning even if words differ.
- Human evaluation: Involves actual human experts reading and scoring AI outputs based on tone, helpfulness, and factual accuracy. Essential for sensitive healthcare or legal chatbots where nuance and strict compliance are critical.
- Human preference evaluation: Ranks different AI responses based on what real users naturally prefer to read or interact with. A/B testing two different email drafting AI tools to see which communication style sales representatives prefer using.
- LLM-as-a-judge: Uses a highly advanced Large Language Model to automatically grade and evaluate the outputs of smaller, specialized models. A cost-effective way to score thousands of automated customer service interactions without requiring manual human review.
Use NLP and generative AI metrics when your model produces free-form text. BLEU and ROUGE are fast and reproducible for translation and summarization benchmarks, but miss semantic nuance. BERTScore and perplexity offer deeper linguistic insight. For production systems or safety-critical applications, human evaluation and LLM-as-a-judge remain essential for validating real-world quality.

Evaluating language models is more complex than evaluating classifiers
3.4. Ranking and recommendation metrics
Ranking and recommendation metrics assess how effectively an AI system orders and suggests relevant items to a specific user. They are crucial for measuring the commercial performance of search engines and personalized recommendation algorithms.
- Precision@K: Measures the proportion of highly relevant items found strictly within the top ‘K’ recommendations provided to the user. If an e-commerce site suggests 5 products (K=5) and 3 are actually bought, the Precision@5 is 60%.
- Recall@K: Calculates how many of the total available relevant items were successfully captured in the top ‘K’ recommendations. If a user genuinely likes 10 movies, and the AI suggests 4 of them in its top 10 list, Recall@10 is 40%.
- Mean Average Precision (MAP): Evaluates the entire ranked list, giving much higher mathematical priority to relevant items that appear at the very top. Essential for an internal corporate search tool where users expect the exact right document to be the number one result.
- NDCG: Accounts for the graded relevance of items, penalizing models heavily if highly relevant results are pushed further down the list. Useful for streaming platforms where placing a “perfect” movie match at rank 1 is vastly better than rank 5.
Use ranking and recommendation metrics whenever the order of outputs matters – search, content recommendation, product discovery, or any retrieval task. Precision@K and Recall@K are simple and interpretable for fixed-cutoff evaluations. MAP is better for multi-query benchmarks. NDCG is the preferred metric when items have graded relevance (not just relevant or not), and position in the ranking carries real business weight.
3.5 Precision vs recall trade-off
One of the most important dynamics in machine learning evaluation is the tension between precision and recall. Understanding this trade-off helps you tune your model not just for abstract performance, but for the outcomes that actually matter in your use case.
- Precision focus: Emphasizing precision minimizes false positives, which is vital when the cost of a wrong alert is extremely high. For example, in an automated email spam filter, you want high precision so important client emails are never accidentally deleted.
- Recall trade-off: Maximizing recall minimizes false negatives, ensuring you catch every possible relevant instance, even if it means tolerating some false alarms. In a medical AI detecting anomalies, you trade off precision for high recall because missing a critical diagnosis is far worse than conducting an extra check.
In practice, improving one almost always comes at the expense of the other. Lowering a model’s decision threshold increases recall, but decreases precision. Raising the threshold does the opposite. The F1-score and the precision-recall curve help you visualize and navigate this trade-off, and the right balance depends entirely on the real-world consequences of each type of error in your specific application.

Understanding this trade-off helps you tune your model not just for abstract performance
4. Role of evaluation metrics in MLOps
In the dynamic field of MLOps, continuous evaluation bridges the critical gap between initial model development and real-world enterprise deployment. By establishing clear evaluation standards, technical teams can effectively mitigate operational risks and confidently accelerate their deployment cycles.
- Model validation before deployment: Evaluation metrics act as a strict operational gatekeeper, guaranteeing that only AI models meeting predefined accuracy and safety standards are approved to go live.
- Monitoring model performance in production: Once an application is deployed, continuous tracking of these vital metrics provides real-time visibility into the system’s health and everyday commercial effectiveness.
- Detecting model drift and performance degradation: By closely analyzing metric dashboards, MLOps teams can quickly spot when shifting real-world data environments cause the AI to lose accuracy over time.
- Supporting retraining decisions: Predetermined metric thresholds provide highly objective, data-driven triggers that tell engineers exactly when an aging model needs to be updated with fresh enterprise data.
To handle these data-intensive operations smoothly, utilizing the GPU Virtual Machine from FPT AI Factory provides the ultimate enterprise infrastructure for large-scale training, rigorous model evaluation, and seamless experiment tracking.

GPU Virtual Machine from FPT AI Factory provides the ultimate enterprise infrastructure (Source: FPT AI Factory)
>> Explore more: A100 vs H100: Which GPU is better for AI workloads?
5. How to choose the right evaluation metric?
Selecting the perfect evaluation metric is rarely a straightforward, one-size-fits-all decision for enterprise teams. To ensure your AI solution delivers genuine operational value, run through this essential checklist before finalizing your project’s success criteria:
- Type of problem: Always start by matching your metric to the fundamental nature of your task, whether you are dealing with classification, regression, NLP, or ranking systems.
- Business objective: Clearly define your ultimate commercial goal to navigate the precision versus recall trade-off, deciding if it is better to be exactly right or comprehensively thorough.
- Class imbalance: If your enterprise dataset is heavily skewed towards one category, avoid standard accuracy and rely on metrics like F1-score or ROC-AUC to get a truthful performance picture.
- Cost of false errors: Analyze the financial or operational risk of false positives versus false negatives, choosing a metric that severely penalizes the most damaging type of mistake for your business.
- Model deployment scenario: Consider the technical environment where the AI will operate, ensuring your chosen metrics account for practical constraints like real-time processing or system latency.
- Offline vs online evaluation: Balance historical offline testing metrics with dynamic online evaluation methods, such as live A/B testing, to capture exactly how real users interact with the deployed model.
| Use Case | Recommended Metric |
| Spam Detection | Precision |
| Fraud Detection | Recall |
| Customer Churn | ROC-AUC |
| Price Prediction | RMSE |
| Text Summarization | ROUGE |
| Search Ranking | NDCG |
Selecting the perfect evaluation metric is rarely a straightforward decision
6. FAQ
6.1. What is the most important evaluation metric in machine learning?
There is no single most important evaluation metric in machine learning because the best choice depends on the specific problem, dataset, and business goal. For example, accuracy may work well for balanced datasets, while precision, recall, or F1-score are more appropriate when dealing with imbalanced data or different error costs. In practice, selecting the right metric means aligning it with what matters most in the real-world application.
6.2. Is accuracy always the best metric?
No, accuracy is not always the best metric because it can be misleading, especially with imbalanced datasets. A model can achieve high accuracy simply by predicting the majority class while completely ignoring the minority class, which may be the most important. Therefore, other metrics like precision, recall, or F1-score are often preferred when class distribution is uneven or when different types of errors have different impacts.
6.3. What is the difference between precision and recall?
Precision measures how many of the predicted positive cases are actually correct, while recall measures how many of the actual positive cases are successfully identified by the model. In simple terms, precision focuses on the accuracy of positive predictions, whereas recall focuses on completeness – how well the model captures all relevant instances. These two metrics often involve a trade-off depending on the problem.
6.4. When should I use F1-score?
You should use the F1-score when you need a balance between precision and recall, especially in cases where the dataset is imbalanced or both false positives and false negatives are important. Since F1 is the harmonic mean of precision and recall, it provides a single metric that reflects both aspects of performance, making it useful for evaluating classification models where neither metric alone is sufficient.
6.5. How do I evaluate machine learning models in production?
In production, machine learning models are evaluated using a combination of offline metrics and real-world monitoring techniques such as A/B testing, user feedback, and tracking business KPIs. It is also important to monitor for data drift, model performance degradation, and fairness over time. Continuous evaluation ensures that the model remains reliable and aligned with real-world conditions after deployment.
In summary, evaluation metrics help organizations measure whether AI models are accurate, reliable, and ready for real-world deployment. Choosing the right metric depends on the problem type, business objectives, and the cost of prediction errors. Key takeaways include:
- Evaluation metrics provide a standardized way to assess AI model performance.
- Different problems require different metrics, such as classification, regression, NLP, or ranking metrics.
- Accuracy alone is often insufficient, especially for imbalanced datasets.
- Precision, recall, and F1-score help balance different types of prediction errors.
- Continuous evaluation and monitoring are essential to detect model drift and maintain performance in production.
- The best metric is the one that aligns technical performance with business outcomes.
Ready to put your algorithms to the ultimate test? FPT AI Factory makes it effortless to begin with our exclusive Starter Plan. New individual users instantly receive $100 in free credits to freely explore our advanced ecosystem for 30 days. There is no complicated setup or tedious approval process, simply register, log in, and start experimenting immediately.
For enterprises managing large-scale deployments or requiring highly customized AI environments, our expert team is ready to assist. Contact FPT AI Factory via our official form to receive a personalized consultation and tailored computing solutions for your specific business needs!
Contact information
- Hotline: 1900 638 399
- Email: support@fptcloud.com
Explore Related Articles:
What is Overfitting and Underfitting in Machine Learning?
What Is AI Infrastructure? Key Components and How It Works